
8 Chapter 10: Methods
Understanding political methodology requires us to return to a few key concepts from previous chapters. The basics of social science inquiry is to explain causation—what causes what—in political, social, or economic phenomena.
There are two variables in this causal relationship: the dependent and independent variables. The dependent variable is the outcome we seek to isolate and study in order to determine what caused it. Independent variables are the potential causes of the dependent variable in question. Once we determine the dependent variable as the focus of the study and a number of independent variables that could potentially be the cause, we need tools, or methods, to observe and draw conclusions. Key to this inquiry is determining the right methods that best explain the phenomenon in question. Once we establish the methods then we can begin the process of data collection, observation, analysis, and inference.
A fundamental divide in methods for political science is the distinction between quantitative and qualitative methods. Quantitative methods principally combines statistics, mathematics, and formal theory as tools for positive research in political science. It is a data-driven approach in which collection, analysis, interpretation, and presentation of numerical data provides inferences and insights into key political questions. Positive research, as previously mentioned, seeks to describe and explain what is, and is in contrast with normative research that seeks prescriptions of what ought to be. Qualitative methods entail a set of tools for explaining political phenomena that are not numerical or statistical and does not seek to count or measure data. Instead, a qualitative approach uses description and observation of non-numerical data to draw inferences. Not all data can be quantified in a way that is useful, particularly human-related data such as behavior or belief, and qualitative methods help us fill the gap. As a sub-field in political science, political methodology is principally the study of how methods are used in the discipline. It is a practical, hands on sub-discipline that gives students direct access to the tools of political inquiry.
Let’s review a few key concepts and approaches in political methodology. First, we will consider some terms and approaches in quantitative methods. Second, we will look at some core principles and dominant approaches to qualitative methods. Lastly, we will discuss the basics of developing a research project that will serve as a template for students to create their own research agenda.
Correlations
Statistical correlations are the most common tool in quantitative methods. Correlations measure the relationship between two variables. A positive correlation implies a relationship in which an increase or decrease in numerical value of one variable corresponds to a similar increase or decrease in the other variable. As an example, let’s look at the relationship between wealth and voting participation: several studies have found a positive correlation between these variables such that higher levels of wealth correspond to a higher likelihood of voting.[1] Moreover, lower levels of wealth tend to correspond to a lesser likelihood of voting. A negative correlation implies a relationship in which one variable increases when the other variable decreases, or vice versa. Let’s consider the variable of voter turnout—what are some variables that can be negatively correlated to voter turnout? We may think of a number of variables that could be tested, such as bad weather, a more stringent registration process, high levels of poverty, or low levels of education. We can test these variables and hopefully gain some insight into what drives higher voter turnout and what obstacles there are to voting.
A correlation, it has often be said, does not necessarily imply causation, but correlations are an indication that there may be causation or some meaningful relationship that can provide insight into political inquiry. Suppose we just collected and analyzed data, maybe for years, gathering mountains of information. Assume further that we organize this information and present it in an accessible and attractive way. What’s missing in this research project? Data can be collected, organized, analyzed, and presented, but at the end of the day the political scientist must ask, “okay, what does all this mean?” What conclusions can be drawn from the analysis of data? What questions remain? The methodological work of a political scientist is not done once a statistical regression is run and a correlation between two variables is determined. An important next step is the task of inference—drawing conclusions based on the correlation and perhaps other observations and correlations as well. Drawing inferences is an essential scientific activity that directly probes the meaning of data and analysis.
Let’s return to the example of a positive correlation between wealth and voting participation. What does this really mean? We may logically infer one thing it does not mean: that voting makes you more wealthy. Voter turnout is the dependent variable in this analysis—an outcome for which we seek causal explanation. It may be that individuals who are wealthy are more likely to volunteer, participate in other civic and political endeavors, run for office, and the like. In this case, wealth may not be such a powerful explanation for voter turnout, but rather a variable that increases the likelihood of many different forms of political participation. On the other hand, wealth may be a more direct cause of voter turnout: the correlation between these two variables may be noticeably higher than between wealth and volunteerism or wealth and running for office. Additionally, we may draw an inference that voting participation increases with wealth because individuals may feel as though they have a larger stake in the political process or are at risk of paying more taxes, etc. This inference suggests a tighter link between wealth and voter participation.
Here is an example of a correlation represented with a scatter plot:
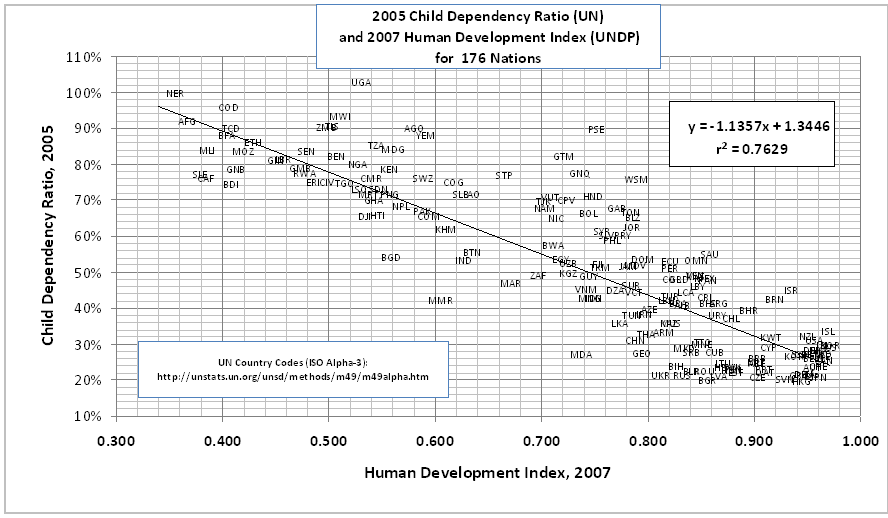
This scatter plot shows the correlation between child-dependency ratio and the UN Human Development Index. A child-dependency ratio is derived by taking the number of dependents (14 years of age and younger and 65 years of age and older) and dividing it by the total population. The N in this statistic is 176: the number of nations in the study. What this statistic suggests is that there is a negative correlation between these values—higher child-dependency ratios correspond to lower human development.
Key Terms in Mathematical Modeling
Doing the work of political science often involves statistics to gather, observe, and organize data, and so it is necessary to understand some basic elements of statistical work. Typically, one begins with a population, the universe of event numbers associated with your study. Out of this population, a researcher can derive a sample that can be observed. Random samples have the advantage of being free from any presumptions a researcher might have and are thus likely to be unbiased. The overall number in a sample is referred to as N. If you survey a random sample of 1,500 people asking them whether they approve or disapprove of a particular politician, the N in this survey is 1,500. A statistic, a numerical measure that describes some property of the population, can be pulled from this sample and analyzed. This statistic will include some form of numerical, or quantitative, data.
There are broadly two types of quantitative data: discrete data, which are typically integers which cannot be divided further or be made more precise, and continuous data, which can be divided into smaller and more precise measurements. An example of discreet data would be the number of representatives in Congress who voted for a particular bill. This will be a whole number that cannot be divided—you cannot have a half or quarter of a representative who voted, the number may be 212 or 213, but cannot be 212.5. An example of continuous data would be the average number of representatives in Congress who voted for appropriations bills over a 10-year period of time. This number could be 212 or 213, but it could also be 212.5 or 212.275.
Data can also be derived from surveys or experiments. Surveys derive data from responses by a group of participants. This group is a sample from the overall population. Survey results can be generalized to the larger population but they are less than precise in predicting causation. Experiments are controlled observations of a particular phenomena and provide experimental data that is not easily generalized but can more precisely predict causation. In political science, conducting experiments can sometimes be impossible, whereas researchers often rely on surveys. The result is that causation is harder to predict in political science, as well as the other social sciences, compared to the natural or so-called hard sciences, where experiments are much more common.
A particular statistic may give us a probability—the likelihood of an event or outcome happening. Further, we may get a probability distribution, which indicates a scale of possible outcomes based on the likelihood of occurring. Probability distributions may be discrete (only certain values, such as whole numbers) or continuous (a range of possible values), along the lines described above. The distribution of data across a scale will provide a mean, median, and mode. A mean is a measure of central tendency, the average of the numbers on the scale, which can be achieved by adding up the value of all the numbers and dividing by how many numbers there are. The median is not an average but the central value on a scale. The mode is the value that occurs most frequently in the scale. If your data scale is the following: 2, 4, 5, 9, and 9, then the mean would be (2+4+5+9+9=29/5=) 5.8, whereas the median would be the value in the middle of this scale (5), and the mode would be 9, the most frequently occurring number.
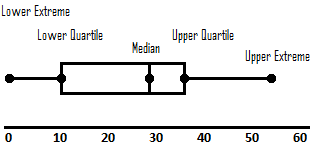
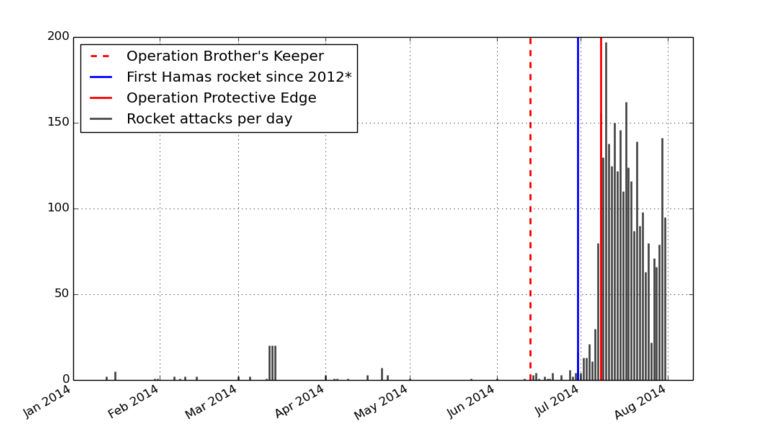
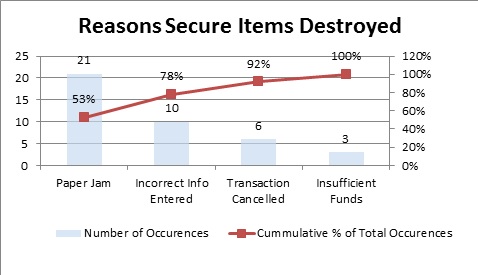
Lastly, we may present data in a number of ways that will be helpful for analysis and drawing inferences. A bar and whisker plot is a representation of groups of numerical data based on quartiles. The box in a box and whisker plot is the area of the inner two quartiles, whereas the whiskers (lines extended out from the boxes) are the highest and lowest quartiles respectively. A bar chart will show the frequency in each value by the height of a bar that represents that value and typically shows the relationship between two variables. A histogram will represent the frequency of values in intervals or “bins” which should be adjacent to one another but do not have to be equal. Histograms typically represent only one variable. A pie chart is a circular graph that shows portions of the total with wedges that represent the size of that proportion. A pareto chart contains both bars and a line graph, the bars representing descending frequency for each value and the line graph representing the cumulative total of frequencies. Finally, a scatter plot locates values (represented as points) along a plot typically determined by two variables, one along the X axis and the other along the Y axis, and can contain a third variable if the points are coded (by color or size, for example).
Qualitative methods
As previously mentioned, not all data can be numeric. Typically, human-related data that is subjective cannot be meaningfully quantified but may nonetheless be important to your research. The meaning of why or the description of how may be essential for answering your research, particularly why and how questions related to the human experience. Quantitative approaches can only count and measure, not give us the why or the how. Qualitative methods seeks to fill in the gap by providing a set of tools that allows for data collection, analysis, organization, and presentation. The typical qualitative approach is the case study—a focused, in-depth account of a single individual, group, organization, action, or event. Researchers who seek more context, depth, and detail of a single case are best suited to the qualitative method, where the absence of large amounts of numerical data make quantitative data collection and analysis impossible. Case studies in themselves are not confined to qualitative data, however, and may employ a mix of both qualitative and quantitative methods and data. A qualitative case study will provide a “thick description” of the case, focusing on the why and how of various phenomena that occur.[2]
In selecting a case, typical or average cases often do not reveal rich detail of information or are meaningful in their context and characteristics. Unique or outlier cases often prove more interested to explain. Because of this, random-sampling of cases, while useful to the quantitative method, are less useful in the qualitative approach. Cases may be selected based on the inherent and unique characteristics of the case, the context that surrounds it, or because the researcher has the prior depth of knowledge of the characteristics or culture of the case that would allow them to immerse themselves in the environment and provide descriptions or accounts that are meaningful. A qualitative case study is therefore less generalizable than quantitative research—if you are providing a thick description of a single, unique case, it makes sense that this case will not tell you very much about other cases. In contrast, quantitative research that includes large amounts of numerical data affords researchers better opportunities to generalize and make claims across cases.
Qualitative research can collect data in a variety of ways, such as interviews, storytelling, analysis of narratives, participant observations, or focus groups, among others. Interviews are a common form of qualitative data collecting in which a researcher asks questions to subjects that are important to the case. Interviews may be highly structured, in which questions are determined beforehand and there is no deviation from the list of questions, or unstructured, in which the researcher and subject engage in open-ended dialog. Narratives and storytelling can be important to understanding a particular culture or community, since stories can form a kind of discursive foundation on which common knowledge is shared and common action is determined. Participant observations can be a good way for a researcher to collect data through simply observing a group interact with one another. Such observations can be passive in the sense that the researcher attempts to remove themselves from the dynamic as much as possible so as not to influence the outcomes, or it can be active, in which a researcher is part of the group interactions and makes observations from within the context of the dynamic. Finally, focus groups allow for more controlled observations of specific interactions and allow a researcher to gather more contextualized data (such as reactions, agreement, or disagreement) than would be possible in isolated interviews.
Field research is a broad term we use to describe data collection and observation on the ground, removed from the academic setting. It is in your field research that you would conduct interviews, focus groups, or participant observations. As discussed in the comparative politics context in Chapter 7, researchers should determine which case is best to study given practical considerations on the ground, the most appropriate form of data collection (interviews, etc.), how long the field research should be conducted (short stays may be more directed, long stays may yield more data), and what sort of resources and skills would be necessary to conduct the research successfully.
Research Design
Designing a research project can be daunting, but it is also an exciting, hands-on way for students to learn more about issues they care about, understand the work of political science and its relevance, and gain insight into how political action and change might make a better world. Outlined below are the basic elements required to begin a research project, a brief description of each of those elements, and a rubric for each element that can give teachers and students a guide as to how a research project assignment may be evaluated. Keep in mind, this outline is not the research itself, only a template. No data will actually be gathered, analyzed, and assessed, and no inferences are drawn.
- Research question (RQ).
- Identify your dependent variable (DV), ie, the focus of your study.
- Potential answers (IVs) to the RQ, ie, the explanation for your DV outcome.
- Why does this question matter (SFW)? What relevance does this have? Why is it important?
- Choose method of data collection and analysis: quantitative (QN), qualitative (QL) or both (BQ)
- Determine form of method for data collection and the ideal data (D). For QN, identify specific statistics and different representations of variables (scatter plot, pie chart, bar graph, etc). You do not actually have to find this data or compile it, so its best to think of this as the ideal data possible for you to answer your question. In the best possible world, what numerical data would I need to best answer the RQ? For QR, determine a unique or outlier case that makes for interesting study. Determine the basic framework of your field research (short or long stay, resources and skills needed, etc.), and identify at least two forms of data collection (interviews, participant observations, etc).
- Identify which political science sub-field is the best fit for this research project.
- An annotated bibliography (BIB) of at least 6 scholarly sources (books or articles, including online sources) that provide some overview or analysis of your topic and can serve as sources for a literary review or extensive background information. This BIB is not a list of your ideal data, but rather scholarly or reputable sources that pertain to the issues surrounding your RQ.
Conclusion
Political methodology is the tool box we use to put theory (ideas about our political world) into practice. Methods allow us test theories, ideas, and assumptions we have, refining our understanding of politics and drawing out meaningful insights and inferences. The vast majority of political inquiry is an inquiry into causation on one level or another, and so research in political science requires a structure that can explain the causes of political phenomena. The first step is designing a research question—developing a starting point of inquiry that is centered on change or variation of some kind. What explains this particular change we see? Why do we get x and not y? Why are two seemingly similar cases produced different outcomes? The explanations or causes are independent variables in social science inquiry, and the dependent variable is the outcome of this change. Typical research in political science will center their study on the dependent variable and seek to explain how this outcome came about by identifying and analyzing independent variables that have potentially caused this outcome. Methods are the tools used to collect and analyze data, scrutinize the independent variables in question, and draw inferences that best explain causes of the dependent variable in question.
Broadly, there are two approaches in political methodology, quantitative and qualitative. Quantitative research typically entails large amounts of numerical data that require mathematical modeling—statistics—to analyze the variables in question. Correlations are statistical indicators that measure the mutual dependence or association between two variables and are commonly used in political science research. These correlations may indicate causation, but not necessarily—the researcher must draw inferences and analyze the strength of the association in order to make claims of causation. Qualitative research entails the collection of non-numerical data, often human-related experiences that are difficult to quantify. Such qualitative data can include interviews, participant observations, and focus groups conducted in field research. Both quantitative and qualitative research should be driven by a research question—a precise, non-banal question that directly centers on explaining some kind of political phenomena we observe in the world.
Media Attributions
- Plot-of-Human-Development-Index-2007-and-Child-Dependency-Ratios-2005-for-176-countries © Fm122 is licensed under a CC BY-SA (Attribution ShareAlike) license
- CNH_Figure_2 © Conhegarty is licensed under a Public Domain license
- 1920px-Yale_climate_US_public_opinion_2018_bar_chart © Yale Program on Climate Change Communication is licensed under a All Rights Reserved license
- Labeled_Box_and_Whisker_Plot © KStrileckis
- Histogram_of_Palestinian_rocket_attacks_on_Israel_per_day,_2014 © Kozrty is licensed under a CC BY-SA (Attribution ShareAlike) license
- RootCauseParetoChart © KellyLawless is licensed under a CC BY-SA (Attribution ShareAlike) license
- World Economic Forum, "Link Between Voting in Elections and Income." 2018: https://www.weforum.org/agenda/2018/07/low-voter-turnout-increasing-household-income-may-help (accessed on July 28, 2019). ↵
- The phrase "thick description" comes from Clifford Geertz, "Thick Description: Towards an Interpretive Theory of Culture," in The Interpretation of Cultures. Basic Books: 1973 ↵
In statistics, a population is a universe of event numbers under study.
