
3 Chapter 3 – Data Analytics
Learning Objectives
3.1 Understand the main components of database structure and design.
3.2 Describe the relationship between data science and data analytics
3.3 Understand the three categories of analytics
3.4 Describe the differences between data analytics and big data analytics
Database structure and design
Data! Data is the ‘power’ to the information system engine. Without it, the system simply would not be able to produce the information needed to reach the goal of improving decision making. But what is it? In reality it is electricity stored and interpreted as a zero or a one, yes, binary code. It is then grouped into bytes and used to fuel the processing phase to ultimately be converted into information.
How the data is stored is critical, however. Improper data storage can lead to junk data, data loss and limited processing abilities. Remember, the quality of our information is dependent on the quality of our data. Improving storage and retrieval for example, can provide new processing or analytical power, which can then improve the information for decision makers – adding value!
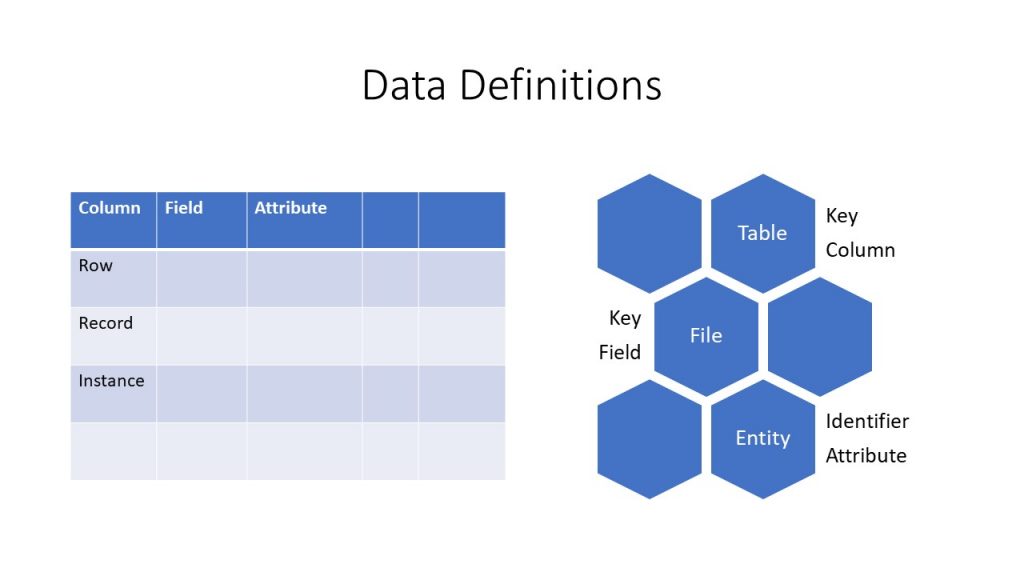
Database design is a complex and multi-stage process, however, beyond the scope of this text. At an introductory level, understanding how data is stored within tables and organized can help with overall system and process designs regardless of the industry. The first step in database design is to ensure everyone is speaking the same ‘language’. In the data world, there is traditional vocabulary, modern vocabulary, and development vocabulary. Each of these sets (traditional, modern, development) uses unique terms that are synonymous with terms in the other sets. Traditional terms include file, record, field, key. Modern terms include table, row, column, key. Development terms include Entity, instance, attribute, identifier.
Starting with the development terms, an Entity is defined as anything that exists that can be represented or quantified by variable and static data. An example we are all familiar with is automobiles. Automobiles exist, and they can have variable and static data. Variable data can change, while static data may be data that normally would not change.
Once an Entity has been identified, the next step would be to assign attributes to the entity. Attributes are characteristics of the entity. In the case of automobiles, these may be VIN number (vehicle identification number), color, type, model, trim, mileage, location, etc. Using traditional terms, one would say the automobile file contains the following fields: VIN, color, type, model, trim, mileage, location. Using modern terms, one would say the automobile table contains the following columns: VIN, color, type, model, trim, mileage, location.
With the columns/fields/attributes defined, the database can now begin to have data added to the database. Note that a single table/entity/file database is typically just a dataset, and databases will typically have more than one table/entity/file. The rows/records/instances of the table/entity/file can then be populated with specific examples of automobiles. For example, my car, a 2012 Subaru Impreza WRX STI would appear as follows:
123XXX456, plasma blue, Subaru, Impreza, WRX STI, 39,000, Hays, KS.
When inputting the data, it was clear that the year of the automobile was missed as there was no column available for the year. In this case, a new column (or attribute) could be added to capture the year.
The true power of databases and datasets, however, is in the ability to reference and combine the tables into powerful relational databases through establishing relationships between the datasets either within the database management system (DBMS) or other specialized software, such as Tableau. The DBMS is a specialized system that is used to secure and access the database to provide security and redundancy to help protect the actual data. Tableau, on the other hand, will allow a user to connect to and combine multiple datasets for analysis.
To tap into the power, one must first identify and remove any additional themes that may exist within the table or entity. These themes are then put into their own table and turn into an entity themselves! The easiest way to identify themes is when a cell (this is the intersection of a row and column) contains a value that is equal to another cell within the same column. In our automobile example, ‘Subaru’ is likely to appear in many other instances of automobiles as there are many Subarus in the automobile marketplace. The cell is located in the ‘type’ column, which means a new Entity, such as manufacturer, could be made for ‘type’. The new attributes for manufacturer may be name, address, categories, year established, etc.
Once each table contains a singular theme, identifiers/keys can be used to establish links, or relationships, between the datasets. In this example, the automobile has an identification number (VIN) that is used to identify the specific automobile. This unique identifying number or text is considered the ‘primary key’. However, this VIN may appear multiple times in another table or dataset such as a servicing record. In the second table, it is known as a secondary key. A secondary key is a primary key in another table. While the primary key needs to be unique within its own table, the secondary key does not need to be unique, but helps ‘identify’ the specific row or instance within the primary table. This link between the primary key and the secondary key is very powerful in relational databases.
Imagine that in the manufacturer table, ‘Subaru’ has a manufacturer ID that is S9834. While that data is meaningless on its own, it is the identifier or primary key for Subaru. Any other table that is created and uses ‘Subaru’ should actually use ‘S9834’ instead of ‘Subaru’. The software or DBMS would then know through the link or relationship created that any row using S9834 would be referring to Subaru. In the future Subaru may change their name to “Subiz” and this is where the keys are very important. Instead of changing the name of every mention of Subaru in all tables, a person would simply have to change the name in the manufacturer’s table. The relationships between the keys would then automatically update all reports, etc. with Subiz instead of Subaru.
Data science, data analytics, and big data
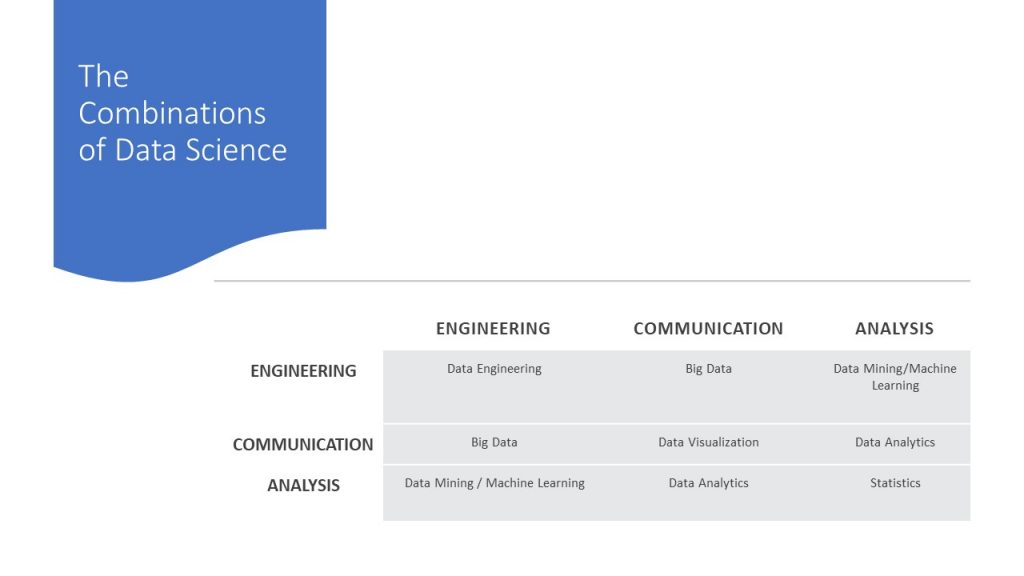
In the world of data, especially recent data trends, there are many new and recycled terms that are used, many with fluid definitions. In the scope of this text, the focus is within the realm of data science, however, more focused on data analytics. The most common terms used to describe the analysis of data are data science, data analytics, and big data. What’s the difference between the terms? Much like information technology and information systems, the terms are differentiated on the components involved. In the data world, the components consist of engineering, communication, and analysis.
Combining the terms in different ways will yield various ‘areas of focus’. Engineering in this context refers to the design, creation, and structure of data and datasets. Communication can be defined as the flow of data from a source or multiple sources to ultimately the user. Finally, analysis refers to statistical techniques used to refine and manipulate data into desired and/or new information. Combining all three areas results in the field of data science. Some may argue that since all the areas combined results in any combination also being data science, the reality, much like information systems needing all five components, data science should contain all three components mentioned above. This means if a component is missing, the result, while part of data science, is also its own area of focus.
A combination of engineering and analysis results in areas of machine learning and data mining. Machine learning involves building and creating the platform for a ‘machine’ to mimic human learning while accomplishing tasks and ‘learning’ how to improve through trials and experience. Data mining, on the other hand, also utilizes building a platform in which to explore data through statistics in order to learn or expose trends within the data.
A combination of engineering and communication results in an area of focus referred to as Big Data. While analysis may occur in this area, the analysis is considerably different than traditional analysis. This area is constantly evolving and expanding as data creation and data needs continues to grow and faster, more secure communication connections are needed to handle the gigantic size of big data datasets.
The final combination is analysis and communication which results in the area of data analytics. While data analytics is heavily focused on statistics, it also incorporates information technologies into statistics. This results in familiar items such as informational dashboards (think of the stock market) along with trend analysis, goal setting, scenario analysis, etc. While data analytics is commonly used to describe data science and vice versa, the distinction or lack of engineering within the area of data analytics drastically changes the preparation needed to participate within data analytics. In particular, it requires a statistical understanding but not a strong mathematical background as the tools used within data analytics are already established, with the new trend being able to communicate the produced information in new ways for users.
Descriptive, predictive, and prescriptive!
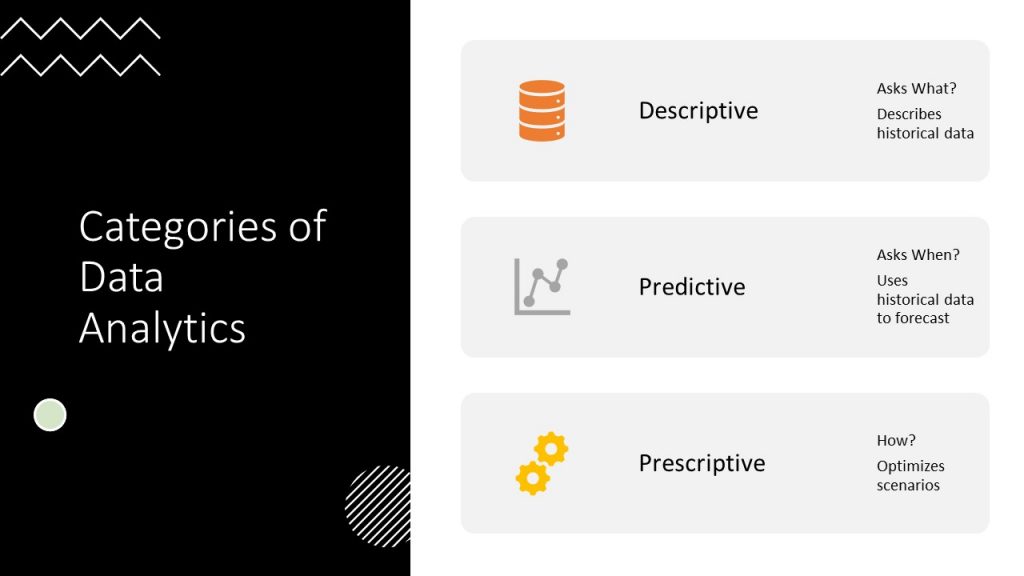
Data analytics is famously known as providing three primary categories. Referring back to earlier chapters, these categories help to define how to complete the data-to-value process. These three primary categories are descriptive, predictive, and prescriptive analytics. Much like past, present, and future, each category strives to provide a user with information based on the premise of what occurred (descriptive), what might occur (predictive), and what can occur? (prescriptive).
Descriptive analytics is almost synonymous with descriptive statistics (except it also involves the communication!) and is most commonly what we as users are used to interacting with when interacting with analytics. Descriptive analytics may be a summary report such as a student’s academic records. They may also include player statistics within a sport, or a map with an overlay of recent crime data. These tables, visualizations, infographics can all be put in this category if they are communicating data that has been processed into information and that data represents the past.
Predictive analytics also uses historical data, however, has the goal of providing some type of insight and probability of a similar dataset being created in the future. While not as widespread as descriptive analytics in the world, predictive analytics are familiar to normal users. Examples may be predicting the odds of a fantasy football player scoring x number of points in the next week of games or using weather data to predict next week’s forecast. This analysis, in a statistical view, includes statistical techniques for probability and regression analysis. Predictive analytics, however, are only as accurate as their dataset and rarely 100% accurate. The shorter the amount of time included in the analysis, the more accurate the predictive models can be due to the reduced amount of change that can occur within the generation of new data.
The final category is prescriptive analytics. The goal of prescriptive analytics is not to use predictive analytics to create a future prediction, but instead create multiple predictions and then provide an optimized solution or recommendation. For example, an information system utilizing prescriptive analytics may optimize supply routes based on traffic and weather patterns. If you use GPS on a long road trip, you may have had the capability of ‘dynamic route updates’, or the suggestion of new alternate routes that may be quicker due to slowing traffic or an accident. On a larger scale, climate analysis is another example of predictive analytics, however, once the system is programmed to provide what-if scenarios and offer guidance on optimal solutions, the system is now using prescriptive analytics.
The three Vs of big data
While Big Data DOES utilize analytics, it is important to understand these analytics are constantly growing, maturing, and evolving as the world of Big Data begins to mature as an area of focus. For organizations, the ability to collect data has become much more cost effective due to advances in technology and the growth of the IoT markets. However, more data does not equal better data. As the size of a data warehouse or data supercenter increases, the ability to use traditional analytical techniques to identify the correct data and transform it into valuable information ultimately becomes too complex for the size of the data. While this line from where data analytics ends and big data analytics begins is blurry, the largely recognized ‘three Vs’ of big data can help.
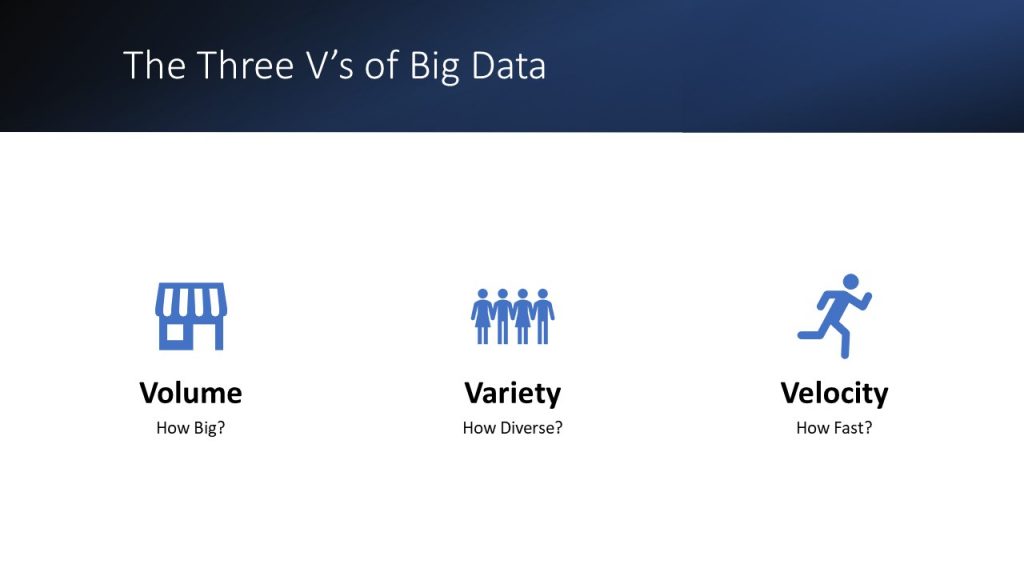
The three Vs consist of volume, variety, and velocity. Volume refers to the size of the datasets. While data can be stored and accessed in what feels like an infinite number of ways, there isn’t a set rule for how large, or how much volume is needed for the datasets. It really depends on the organization’s processing power and the statistical/analytical techniques that are needed. While volume can refer to a single dataset, the plural term was purposely used as typically multiple sources of data are used when using big data analytics.
Variety, while related to volume, refers to the types of data used within the dataset or datasets being selected for analysis. If the data contains a large amount of variety, this can reduce the amount of volume needed before the analysis would be placed in the realm of big data. With more complexity introduced through the variety of the data, the traditional analytical techniques are also reduced, and with a large volume traditional statistical software may simply not be able to handle the complexity and size.
The final v of Big Data is velocity. Big datasets can be so large in size that they can’t necessarily be moved from storage to analysis, but instead they need to be ‘streamed’ through the analysis much like cassette tapes would go through a cassette player. Velocity refers to the speed in which all sources can work together and be analyzed. So as the volume and variety increase, the ability to provide adequate velocity to traditional analysis decreases. When the reliability of this begins to falter, big data begins to emerge as the solution for the analysis.
While Big Data can sound cumbersome and bothersome, it is a very exciting area! At this current time, it is just beginning to grow, and the field is rapidly evolving and providing amazing new opportunities for data scientists and data analysts to explore large, complex, collections of data in ways that has not occurred before. An example of a current company that highly utilizes big data in order to better target consumers is Netflix. The recommendations you see were likely compiled using big data to create user profiles based on large watching patterns across the world.
Chapter 3 Assignment
Overview
This assignment will help you understand the basic concepts involved with datasets and analytics.
Assignment
Locate and define a dataset and create a single source of information.
-
- Use a browser to navigate to: https://catalog.data.gov/dataset
- Filter the dataset catalog by csv by clicking the csv format on the left.
- Explore the datasets until you find one of interest to you.
- Finding a good dataset WILL take some time.
- In a word document complete the following:
- Provide a link to your dataset.
- Provide a brief description of the dataset (in your own words).
- List all the fields/columns included in the dataset.
- Answer the question: How many observations (rows) are there?
- Use a browser to navigate to: https://catalog.data.gov/dataset
-
- Finally, create a source of information:
- A source of information, in this context, refers to the visual charting of two or more fields (such as time and money) or the manipulation of a field (such as a sum, average, etc.).
- Create a visual graphic that uses manipulation of a field or two or more fields to produce an important source of information from your dataset.
- Describe why/how this information could be useful.
- Finally, create a source of information:
Grading
A satisfactory submission will include a dataset and a relevant description of the dataset. An attempt should be made to provide a visual graphic.
A beyond satisfactory submission likely will include an accurate description of the dataset and provide a relevant source of information that adds value to the dataset and to the viewer.
