
12 Data and Data Analysis
Data analysis is all around us – in the news or printed in a newspaper or magazine. We all tend to look at the picture/graph, but not think about the analysis of that data. Therefore, our students have experience with the images related to data, but not the analysis. Data analysis is the processing of data in order to find useful information that will help make decisions.
“Data analysis is a body of methods that help to describe facts, detect patterns, develop explanations, and test hypotheses. It is used in all of the sciences. It is used in business, in administration, and in policy” (Levine, 1997). Data analysis provides numerical results; it finds the number that describes a typical value and finds the differences among numbers; it finds averages. But data analysis is not about the numbers – it uses the numbers to answer questions such as “How does it work?”
There are three “rules” of data analysis. First, we look at the data, think about the data, think about the problem, and ask what it is we want to know. Second, we estimate the measures of central tendency of the data, and third, we look at exceptions to the central tendency.
Data analysis includes sorting and classifying data, collecting data, and organizing and presenting data. Some examples of data analysis include a tally table, line plot graphs, bar graphs, pictographs, histograms, pie charts, and coordinate grids.
There are two main types of data, categorical data and numerical data. Categorical data is the type of data that can be put into groups or categories with labels, and describes categories or groups. This is often done according to the characteristics and similarities of the data, such as favorite foods, types of food, or favorite sports. Categorical data can only be placed in one category. Numerical or measurement data is quantitative data that is measurable; such as time, height, weight, amount, etc., or it is a count, such as the number of books a person has.
In kindergarten through grade 5, students mainly focus on categorical data. Specifically, students in kindergarten classify objects into categories; in first grade, students organize and represent categorical data; and in second grade, students draw picture graphs and bar graphs to represent data. Third grade is the most important in the development of categorical data in that students draw picture graphs with each picture representing more than one object, and bar graphs in which the height of each bar is multiplied by a scale factor in order to determine the number of objects in each category.
In grades K-1, students identify and describe measurable attributes. Beginning in second grade, students work with measurement data as they measure lengths. One way to display this data is with a line plot. By the end of fifth grade, students are comfortable with drawing a line plot and analyzing the data so that in sixth grade, students can reason statistically.
Teaching Data and Data Analysis in the Elementary Grades
Students in kindergarten identify and describe the measurable attributes of objects. Students should be given multiple opportunities to describe the attributes. In addition, students should directly compare objects, such as two pencils next to each other in which a student would say, “This pencil is longer.” Be sure when students are making direct comparisons that they pay attention to the starting point and see that the two objects must be lined up at the end. At this grade level, students are recognizing and describing the similarities and differences of measurable attributes, such as longer than, shorter, than, taller than, the same size.
As kindergarten students begin to identify the similarities and differences between objects, they use those identified attributes to sort the objects and give the category a name.
The website “Which One Doesn’t Belong?” is a resource for teachers and students to help students describe attributes of objects.
First grade students can sort a collection of objects, ask questions about the number of objects in each category, and total the number of objects. Then they can compare the number of objects in each category. Students can create graphs and tally charts of real-world situations, such as favorite ice cream, pets, etc.
Teachers must be sure to ask questions about the data in order to provide a foundation for data analysis. For example, students were asked, “What is your favorite pet? Dogs, cats, or hamsters? Students responded and created the chart below.
| What is your favorite pet? | |
| Dogs | 12 |
| Cats | 8 |
| Hamsters | 3 |
Teachers then need to help students interpret the data. They ask, “What does the data tell us?” and “Does it answer our question?”
- More people like dogs than cats and hamsters.
- Only 3 people liked hamsters as pets.
- 8 people liked cats.
- 4 more people liked dogs than cats.
- The number of people who liked hamsters was 3 less than the number of people who liked cats.
- 23 people answered the question.
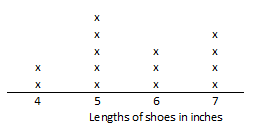
In second grade, students represent and interpret data as they measure the lengths of several objects in order to generate measurement data. Students then create a line plot by drawing a number line and then placing an X above the value on the line. Students must be sure to be consistent and line up the Xs so that their line plot resembles a bar graph.
For example, students measure the lengths of their shoes to the nearest whole inch. The class results are on the line plot below.
Number of Shoes Measured
Students also begin to work with categorical data as they organize, represent, and interpret the data. They should draw both pictographs and bar graphs. At this level, pictograph symbols should represent one unit. All pictographs should include a title, categories, category label, key, and data. Bar graphs should be both horizontal and vertical, and be sure to emphasize that all bar graphs require a title, scale, scale label, and category label and data.
In third grade, students read and solve problems using scaled graphs before they draw one.

Representing and interpreting data is a common cluster throughout grades 1-5. In kindergarten, students identify and describe measurable attributes of objects, directly compare two objects, and identify the similarities and differences between objects. In first grade, students create graphs and tally charts using data that is relevant in their lives, and second grade students make line plots, draw picture graphs, and bar graphs to represent a data set. Third grade students build on the work they did in second grade and continue to draw picture graphs and bar graphs.
processing data to find useful information that will help make decisions
The “central value” of two or more numbers. Mean, median, and modes are measures of central tendency.
a collection of information that can be divided into specific groups, such as favorite color, types of food, favorite sport, etc.
data that is expressed in numbers rather than word descriptions
